Some selected functionalities and packages
using DataFrames
using CategoricalArrays
Frequency Tables
using FreqTables

df = DataFrame(a=rand('a':'d', 1000), b=rand(["x", "y", "z"], 1000))
ft = freqtable(df, :a, :b) ## observe that dimensions are sorted if possible
4×3 Named Matrix{Int64}
a ╲ b │ x y z
──────┼───────────
a │ 71 83 95
b │ 95 90 87
c │ 90 68 91
d │ 87 69 74you can index the result using numbers or names
ft[1,1], ft['b', "z"](71, 87)getting proportions - 1 means we want to calculate them in rows (first dimension)
prop(ft, margins=1)4×3 Named Matrix{Float64}
a ╲ b │ x y z
──────┼─────────────────────────────
a │ 0.285141 0.333333 0.381526
b │ 0.349265 0.330882 0.319853
c │ 0.361446 0.273092 0.365462
d │ 0.378261 0.3 0.321739and columns are normalized to 1.0 now
prop(ft, margins=2)4×3 Named Matrix{Float64}
a ╲ b │ x y z
──────┼─────────────────────────────
a │ 0.206997 0.267742 0.273775
b │ 0.276968 0.290323 0.25072
c │ 0.262391 0.219355 0.262248
d │ 0.253644 0.222581 0.213256x = categorical(rand(1:3, 10))
levels!(x, [3, 1, 2, 4]) ## reordering levels and adding an extra level
freqtable(x) ## order is preserved and not-used level is shown4-element Named Vector{Int64}
Dim1 │
──────┼──
3 │ 2
1 │ 6
2 │ 2
4 │ 0by default missing values are listed
freqtable([1,1,2,3,missing])4-element Named Vector{Int64}
Dim1 │
────────┼──
1 │ 2
2 │ 1
3 │ 1
missing │ 1but we can skip them
freqtable([1,1,2,3,missing], skipmissing=true)3-element Named Vector{Int64}
Dim1 │
──────┼──
1 │ 2
2 │ 1
3 │ 1df = DataFrame(a=rand(3:4, 1000), b=rand(5:6, 1000))
ft = freqtable(df, :a, :b) ## now dimensions are numbers2×2 Named Matrix{Int64}
a ╲ b │ 5 6
──────┼─────────
3 │ 222 281
4 │ 287 210this is an error - standard array indexing takes precedence
try
    ft[3,5]
catch e
    show(e)
end
BoundsError([222 281; 287 210], (3, 5))you have to use Name() wrapper
ft[Name(3), Name(5)]222DataFramesMeta.jl
https://
using DataFramesMeta

df = DataFrame(x=1:8, y='a':'h', z=repeat([true,false], outer=4))expressions with columns of DataFrame
@with(df, :x + :z)8-element Vector{Int64}:
2
2
4
4
6
6
8
8you can define complex operations code blocks
@with df begin
    a = :x[:z]
    b = :x[.!:z]
    :y + [a; b]
end
8-element Vector{Char}:
'b': ASCII/Unicode U+0062 (category Ll: Letter, lowercase)
'e': ASCII/Unicode U+0065 (category Ll: Letter, lowercase)
'h': ASCII/Unicode U+0068 (category Ll: Letter, lowercase)
'k': ASCII/Unicode U+006B (category Ll: Letter, lowercase)
'g': ASCII/Unicode U+0067 (category Ll: Letter, lowercase)
'j': ASCII/Unicode U+006A (category Ll: Letter, lowercase)
'm': ASCII/Unicode U+006D (category Ll: Letter, lowercase)
'p': ASCII/Unicode U+0070 (category Ll: Letter, lowercase)@with creates hard scope so variables do not leak out
df2 = DataFrame(a = [:a, :b, :c])
@with(df2, :a .== ^(:a)) ## sometimes we want to work on a raw Symbol, ^() escapes it
3-element BitVector:
1
0
0x_str = "x"
y_str = "y"
df2 = DataFrame(x=1:3, y=4:6, z=7:9)
# $expression inderpolates the expression in-place; in particular this way you can use column names passed as strings
@with(df2, $x_str + $y_str)3-element Vector{Int64}:
5
7
9@subset: a very useful macro for filtering
@subset(df, :x .< 4, :z .== true)create a new DataFrame based on the old one
@select(df, :x, :y = 2*:x, :z=:y)create a new DataFrame adding columns based on the old one
@transform(df, :x = 2*:x, :y = :x)sorting into a new data frame, less powerful than sort, but lightweight
@orderby(df, :z, -:x)Chaining operations
https://
using Chain

@chain df begin
    @subset(:x .< 5)
    @orderby(:z)
    @transform(:x² = :x .^ 2)
    @select(:z, :x, :x²)
endWorking on grouped DataFrame
df = DataFrame(a = 1:12, b = repeat('a':'d', outer=3))
g = groupby(df, :b)groupby+combine in one line
using Statistics

@by(df, :b, :first = first(:a), :last = last(:a), :mean = mean(:a))the same as by but on grouped DataFrame
@combine(g, :first = first(:a), :last = last(:a), :mean = mean(:a))similar in DataFrames.jl - we use auto-generated column names
combine(g, :a .=> [first, last, mean])perform operations within a group and return ungrouped DataFrame
@transform(g, :center = mean(:a), :centered = :a .- mean(:a))this is defined in DataFrames.jl
DataFrame(g)actually this is not the same as DataFrame() as it preserves the original row order
@transform(g)Row-wise operations on DataFrame
df = DataFrame(a = 1:12, b = repeat(1:4, outer=3))such conditions are often needed but are complex to write
@transform(df, :x = ifelse.((:a .> 6) .& (:b .== 4), "yes", "no"))one option is to use a function that works on a single observation and broadcast it
myfun(a, b) = a > 6 && b == 4 ? "yes" : "no"
@transform(df, :x = myfun.(:a, :b))or you can use @eachrow macro that allows you to process DataFrame rowwise
@eachrow df begin
    @newcol :x::Vector{String}
     :x = :a > 6 && :b == 4 ? "yes" : "no"
endIn DataFrames.jl you would write this as:
transform(df, [:a, :b] => ByRow((a,b) -> ifelse(a > 6 && b == 4, "yes", "no")) => :x)You can also use eachrow from DataFrames to perform the same transformation. However @eachrow will be faster than the operation below.
df2 = copy(df)
df2.x = Vector{String}(undef, nrow(df2))
for row in eachrow(df2)
   row[:x] = row[:a] > 6 && row[:b] == 4 ? "yes" : "no"
end
df2StatsPlots.jl: Visualizing data
https://
using StatsPlotsA showcase of StatsPlots.jl functions
using Random
Random.seed!(1)
df = DataFrame(x = sort(randn(1000)), y=randn(1000), z = [fill("b", 500); fill("a", 500)]);
a basic plot
@df df plot(:x, :y, legend=:topleft, label="y(x)", seriestype=:scatter)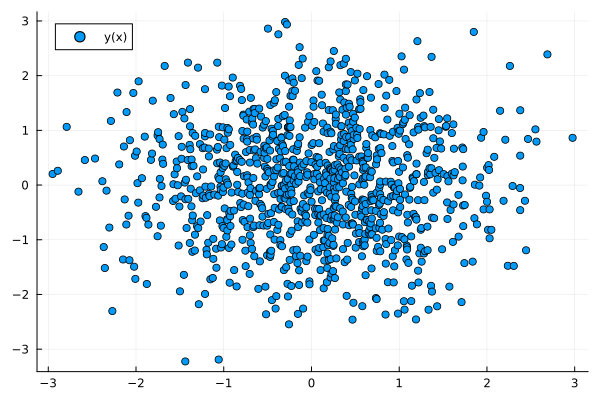
a density plot
@df df density(:x, label="")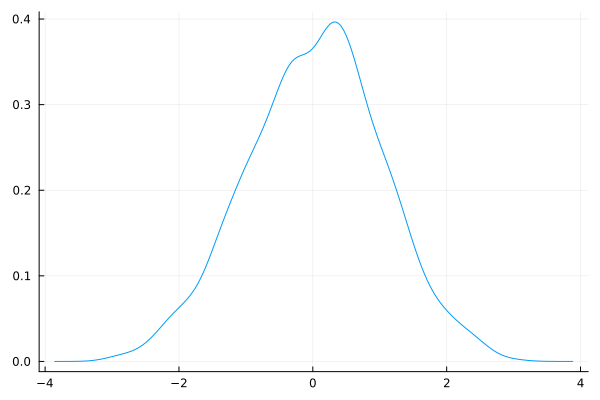
a histogram
@df df histogram(:y, label="y")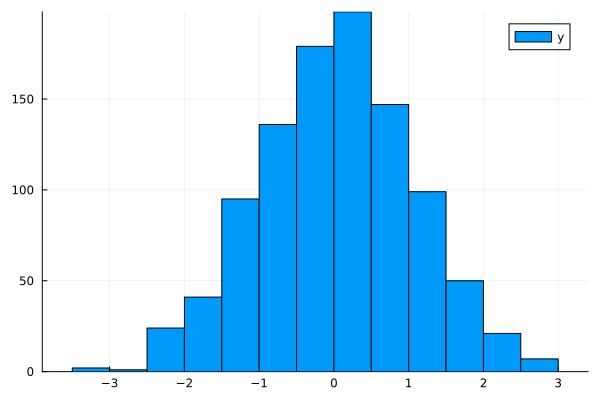
a box plot
@df df boxplot(:z, :x, label="x")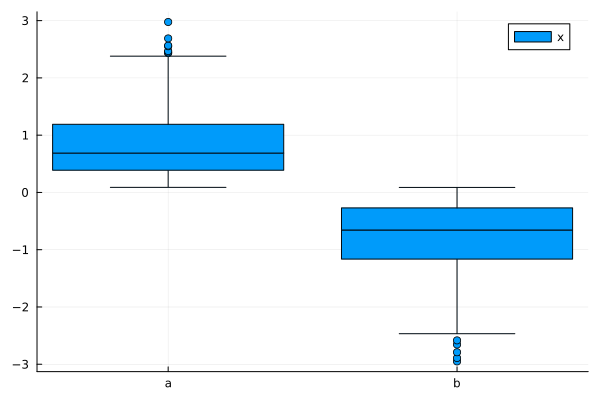
a violin plot
@df df violin(:z, :y, label="y")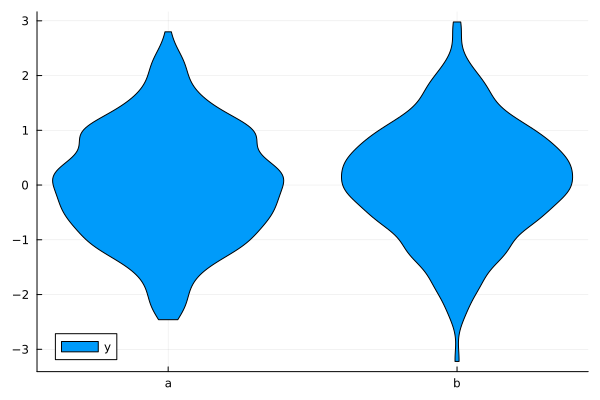
This notebook was generated using Literate.jl.